A Prolific First Half for ETF Flows
US exchange-traded funds raked in $413 billion over the first six months of 2024.

Key Takeaways
- The Morningstar Global Markets Index notched a 10.4% gain in the first half of 2024.
- Fewer forecast interest-rate cuts underpinned the Morningstar US Core Bond Index’s 0.6% loss.
- Large-cap exchange-traded funds led the US equity cohort in absolute flows and organic growth rate.
- Foreign-large blend funds headlined the international-equity group with $30 billion of inflows.
- Balanced inflows helped bond ETFs rack up $120 billion of new money in the first half.
- IShares hauled in $47 billion in June 2024—a monthly inflow record for ETF providers.
Market Summary
Exhibit 1 shows the June 2024 returns for a sample of analyst-rated ETFs that cover major sections of the stock and bond markets. A blended global portfolio notched a 1.3% return in June, pushing its gain to 6.1% for the first half of 2024. Stock tentpole Vanguard Total World Stock ETF VT climbed 1.6% in June and 10.5% for the year to date.
The bond sleeve didn’t hold up its end of the bargain—Vanguard Total Bond ETF BND and Vanguard Total Bond International ETF BNDX each shed between 0.5% and 0.6% in the first half—but it finished on a high note in June. Both components notched gains for the second straight month.
June Market Performance Through the Lens of Analyst-Rated ETFs
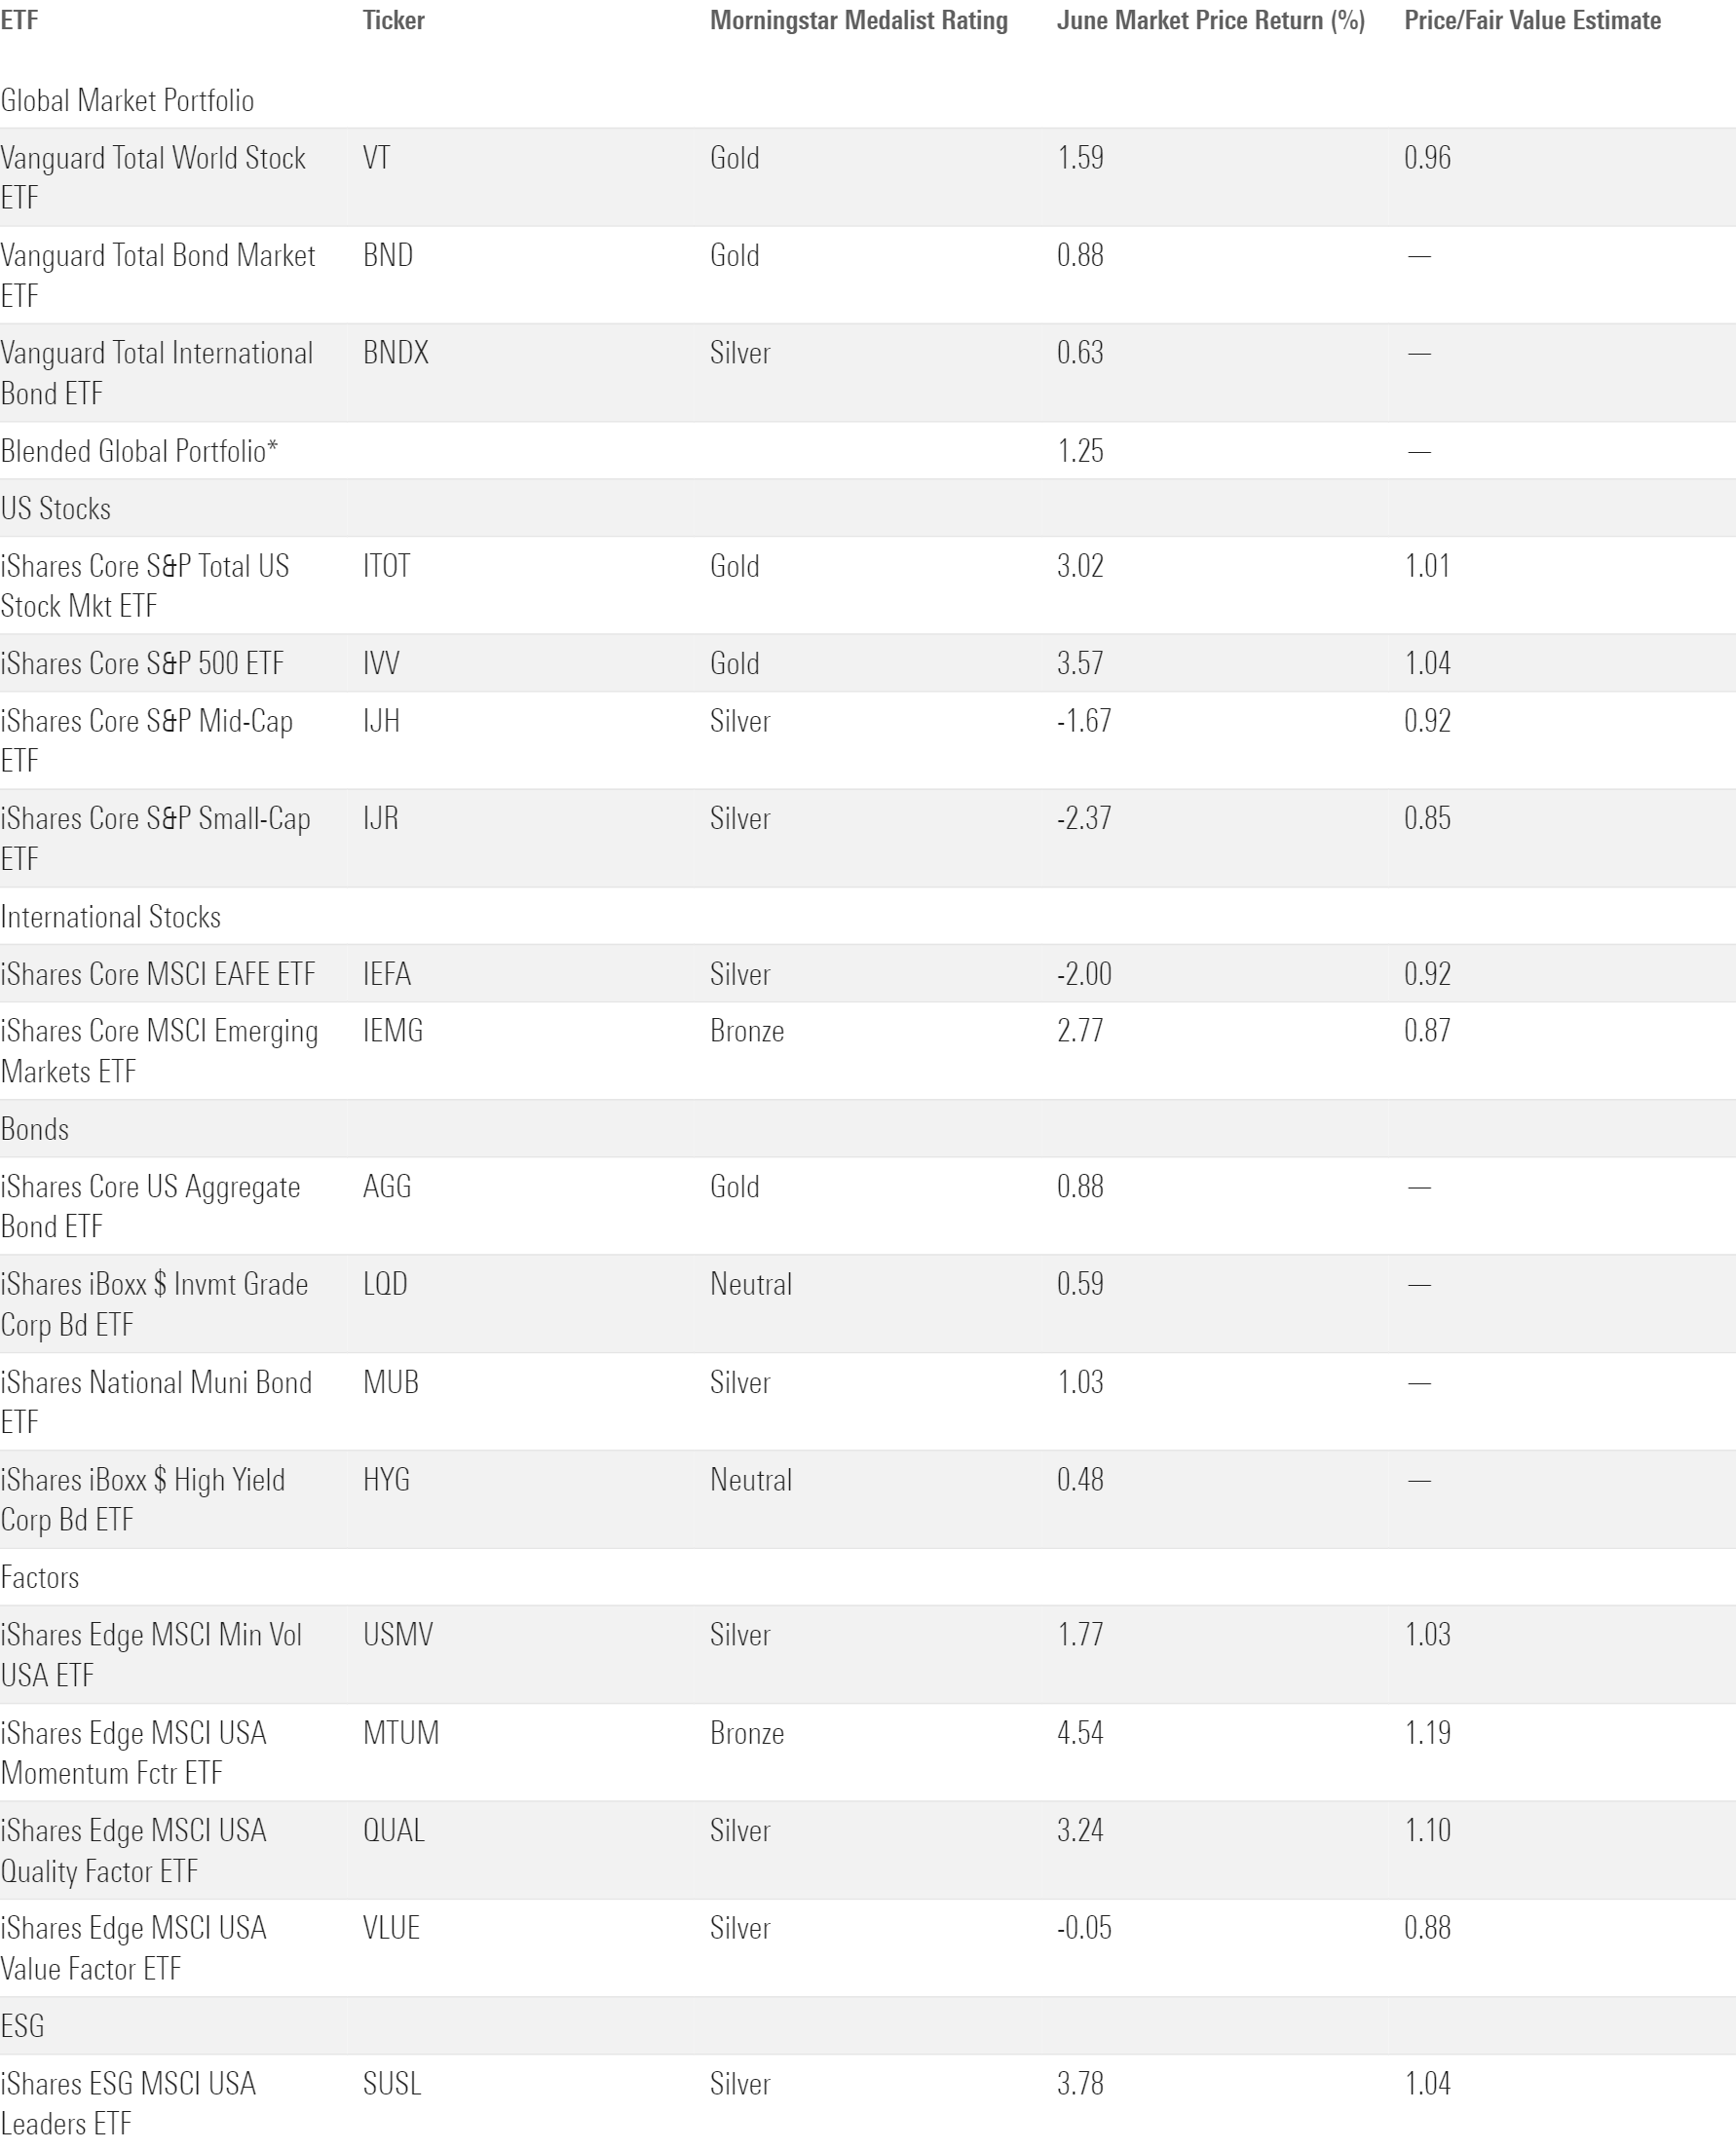
US stocks thrived in the first half thanks to insatiable demand for artificial intelligence and the parts that make it work. Since that was the main engine behind 2023′s market rally, it makes sense that this year’s rally has been concentrated as well. Mega-cap companies tied to AI have covered up middling performance elsewhere in the market. IShares Core S&P 500 ETF IVV soared 15.3% in the first half, while Invesco S&P 500 Equal Weight ETF RSP turned in a 5.0% return. IShares Core S&P Small-Cap ETF IJR didn’t even eke out a gain, sinking 0.8% in the first half.
The same imbalance trickled through growth and value funds. Vanguard Growth ETF VUG shot up 20.6% in the first half after entering the year with stars Nvidia NVDA, Alphabet GOOGL, and Meta META among its top 10 holdings. Vanguard Value ETF VTV trailed well behind with an 8.7% return. It was one of many value funds watching the market leaders from the sidelines, while slower sectors like real estate and basic materials kept a lid on its returns.
Vanguard Total International Stock ETF VXUS advanced 5.3% in the first half in a solid if inconspicuous performance. Developed- and emerging-markets stocks both did their part. IShares Core MSCI Emerging Markets ETF’s IEMG 6.9% gain landed just ahead of iShares Core MSCI EAFE ETF’s IEFA 5.1%. Taiwan and Netherlands stocks powered the respective funds over the past six months.
Performance was bleaker for bonds. At the start of 2024, markets forecast several interest-rate cuts in the coming year—an expectation reflected in bond prices. Persistent above-target inflation and warm economic data threw cold water on those plans. That left broad bond indexes with modest drawdowns and long-term bond funds with another bruise. IShares 20+ Year Treasury Bond ETF TLT lost 4% in the first half and has lost one third of its total value since the Federal Reserve started hiking rates in early 2022.
Some pockets of the bond market held their own. Vanguard Short-Term Bond ETF BSV booked a modest 0.9% return, in line with many of its Morningstar Category peers. SPDR Bloomberg High Yield Bond ETF JNK rode narrowing credit spreads to a 2.3% first-half gain. And bank loans picked up where they left off after an excellent 2023 campaign. Invesco Senior Loan ETF BKLN returned 3.5% following its 12.5% burst last year.
Both the stock and bond markets offered points of pain and premium in the first half. Many of the segments that scuffled early on may come with attractive “for sale” tags entering the second half. Morningstar’s third-quarter market outlook sorts out what looks under and overvalued at halftime.
ETF Flows Accelerate in the First Half
Investors poured roughly $413 billion into US ETFs in the first half of 2024, their highest semiannual total since the back half of 2021. ETFs are on pace to blow past their annual inflows from 2023 ($583 billion) and 2022 ($591 billion). Chasing down the record $901 billion from 2021 will be a tougher task but remains well within reach.
A healthy economy, attractive bond yields, and low volatility in the stock market all make for a comfortable investing backdrop. The rise of model portfolios and active ETFs could represent tailwinds for the ETF structure specifically. Whatever the reason, flows into ETFs have surged since $98 billion of inflows in November 2023 kicked off their hot streak.
First-Half Flows Across Morningstar Broad Category Groups

Large Caps, Growth Dominate US Equity Flows
US equity funds raked in nearly $199 billion in the first half. Flows followed performance within the cohort: Large-cap and growth funds were in vogue, while small-cap and value strategies failed to garner the same attention.
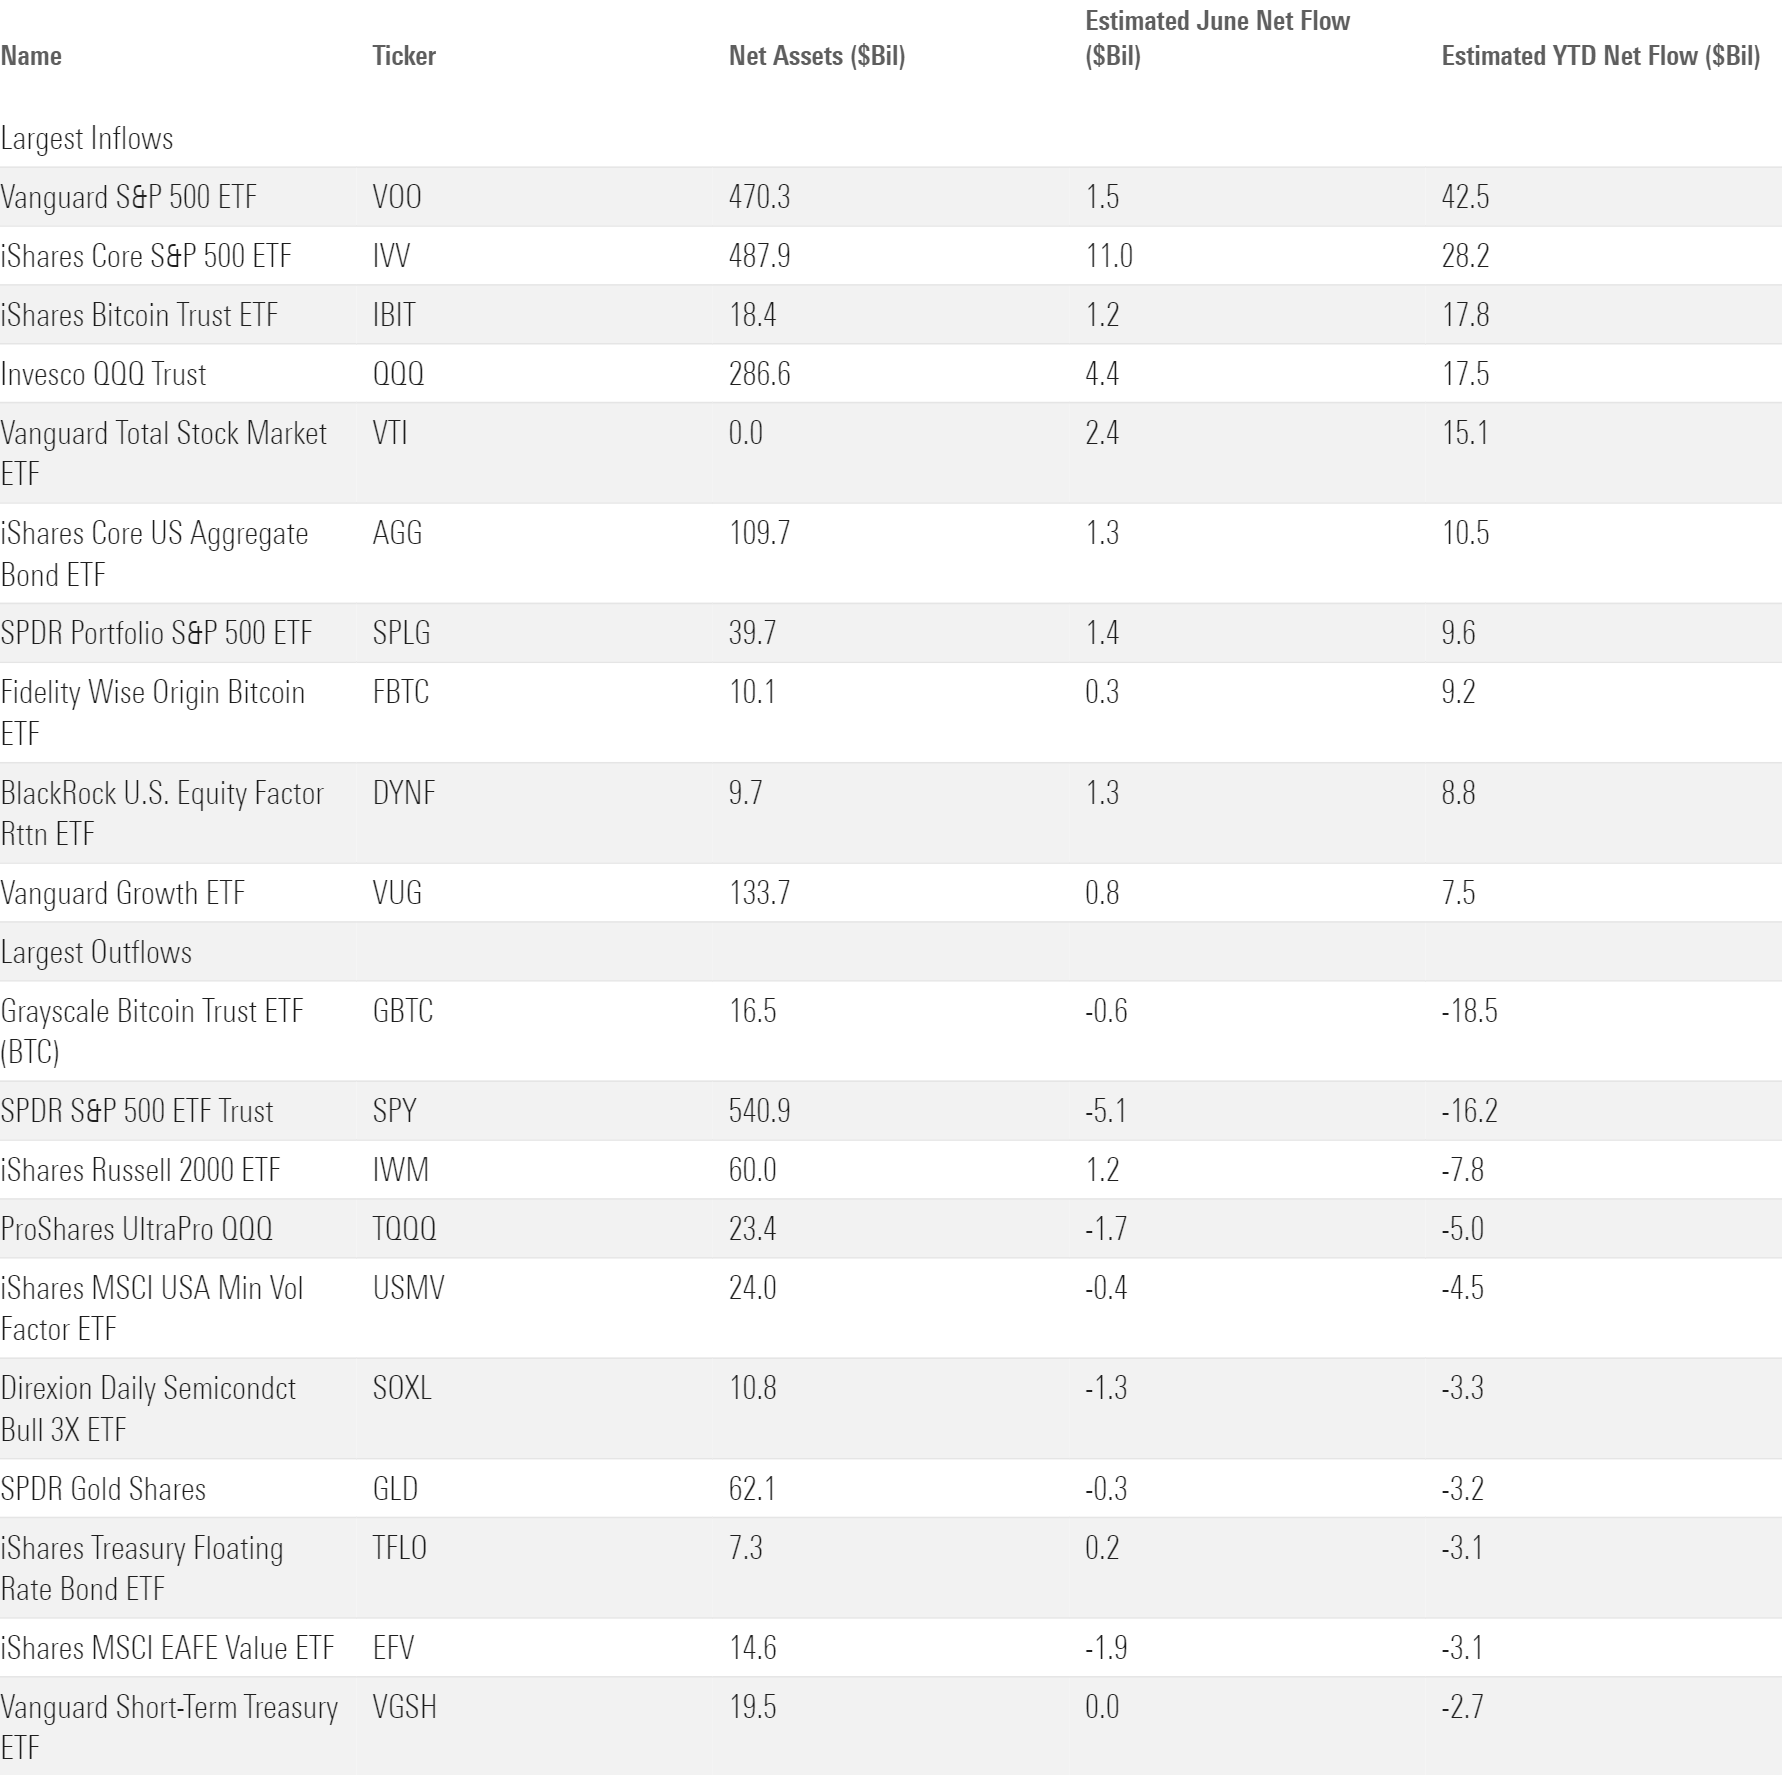
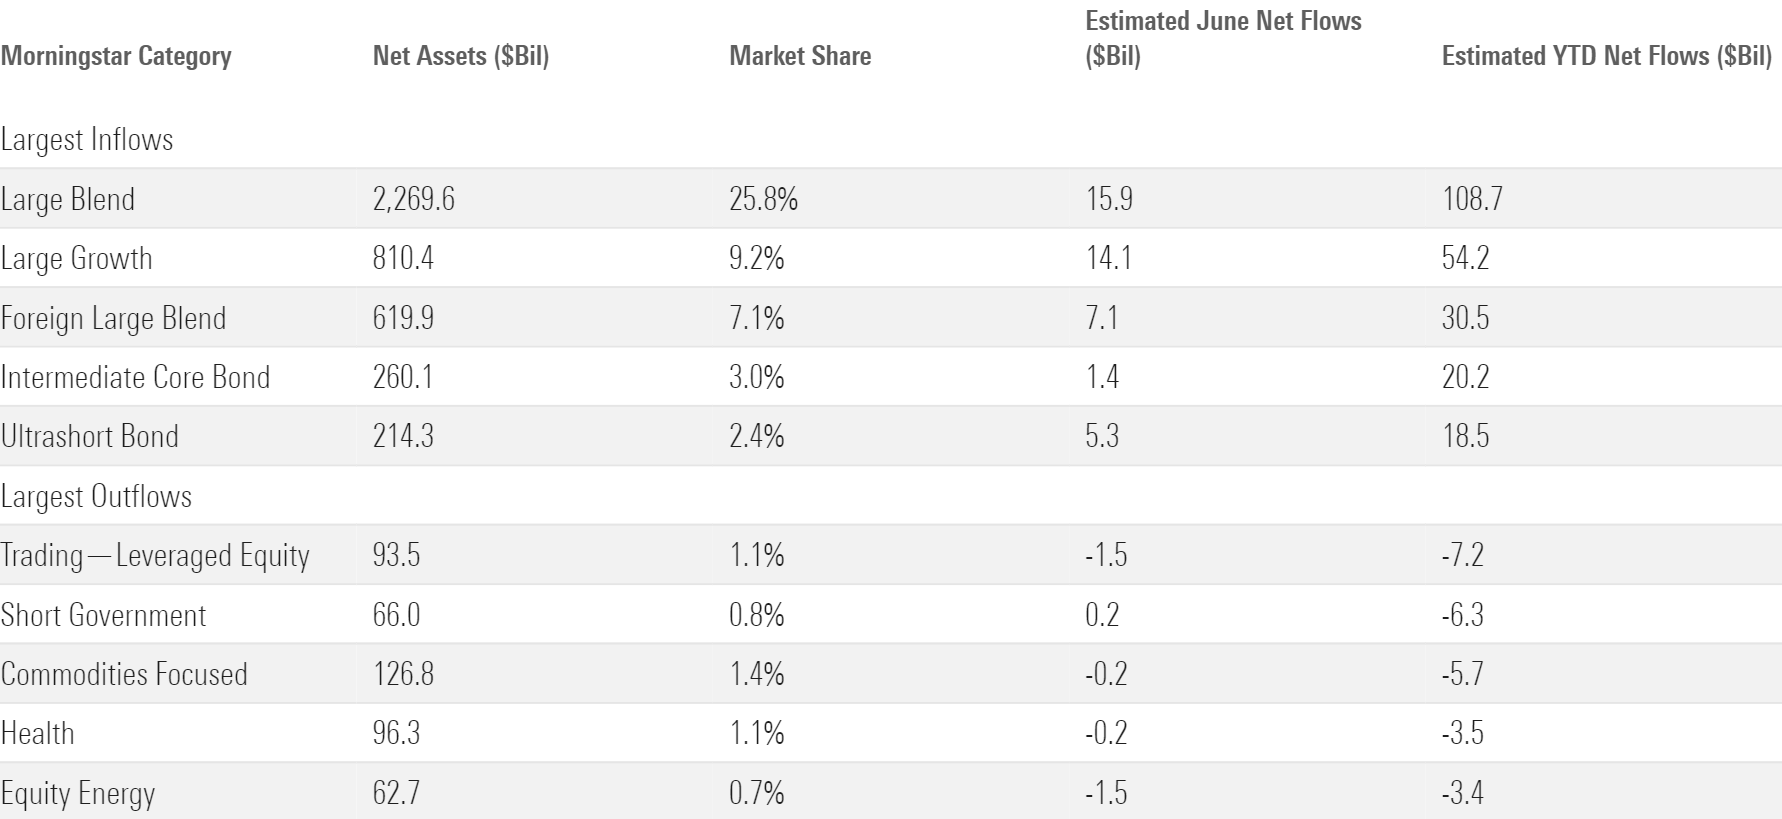
It’s no surprise to see the large-cap blend, value, and growth categories attract the most inflows because they are the three largest. But large-cap funds have ruled the roost even when scaled for size. The large-cap trio collectively grew 4.9% organically in the first half, more than double small caps’ 2.4% rate. It’s true that mid- and small-cap stocks help constitute total market funds like Vanguard Total Stock Market ETF VTI, which sit in the large-blend category. Investors may be cutting out mid- and small-caps altogether as their long slumber continued in the first half.
A similar phenomenon unfolded between style funds, where the better performer (growth) has generated much larger flows than the weaker (value). The large-growth category reeled in $54 billion in the first half. Invesco QQQ Trust QQQ is ancient in ETF years but still has its fastball, leading the category with $18 billion of inflows in the first six months of 2024 as offshoot Invesco Nasdaq 100 ETF QQQM chipped in $6.7 billion of its own.
Large-value funds gathered $9 billion in the first half. The demise of dividend funds helps explain the category’s lethargic growth. Large-value dividend strategies shed $3.3 billion in the first half, continuing a downward trend that quickly followed their breakout year in 2022. Then, defensive stocks were in demand and yield was hard to come by. Higher interest rates and AI fever have pushed dividend-focused funds to the back burner.
ETFs With the Largest First-Half Flows
Blend Still the Trend for International-Stock Funds
Growth funds were more popular in the foreign-stock arena as well, but those are small potatoes compared with the foreign large-blend category. The $620-billion category represents nearly half the international-equity group and is expanding its realm. Foreign large-blend funds gathered $30 billion of inflows in the first half, good for 55% of the cohort’s net flows and an organic growth rate better than the next four-largest categories. Broad index trackers are hard to dislodge in the international space—just like the US.
More focused foreign-equity investors are focused on India and Japan, where breakouts in 2023 carried their momentum through the first half of 2024. The India-equity category started the year with $13 billion in assets and pulled in $4.7 billion more by June (38% organic growth rate). Japan-stock funds pulled in $4.2 billion that measured out to a 14% organic growth rate.
Morningstar Categories With the Largest First-Half Flows
Tech or Bust for Sector-Equity Flows
The technology category is Atlas, and the rest of the sector-equity group is the globe on its back. In the past six months, technology funds collected $15 billion while other sector-equity categories collectively bled $6 billion. Ten of the 16 categories finished the first half in outflows, headlined by healthcare and equity energy with more than $3 billion in outflows apiece.
High demand for tech funds is a predictable consequence of a rally running on AI enthusiasm. Many investors have zoomed in to the industry level to distill their AI exposure. VanEck Semiconductor ETF SMH hauled in $4 billion in the first half, tops among sector-equity funds and more than any other sector-equity category. Others have moved on to the utilities sector. This second-order play forgoes the pure AI companies for those that meet their intense power needs. The utilities sector booked inflows north of $750 million in both May and June.
Bond ETF Flows Are Balanced
Bond ETFs notched their second-best semiannual period ever in the first half. The $120 billion they raked in was a product of balance: 14 of the 21 taxable-bond Morningstar Categories finished the first half with inflows, and 10 of those exceeded $5 billion.
Investors filed into bond segments that court varying degrees of credit risk. Treasuries rolled a lucrative 2023 into 2024 behind strong inflows into long- and intermediate-government bond funds (though short-term ones languished). Riskier bank-loan, high-yield, and multisector bond funds anchored the other end of the spectrum, gathering between $5 billion and $6 billion each. Corporate-bond and intermediate-core plus funds are also on pace to blow past their 2023 marks. Performance could explain broadening fixed-income flows as credit-oriented strategies have beaten the ones that focus on term risk.
The rise of active bond ETFs has been a boon for smaller taxable-bond categories. Bank loans and multisector bonds are more conducive to active management than the Treasury categories. As more active ETFs have hit the market in those nooks, investors have found their way through their doors.
Active ETF Flows Keep Rolling In
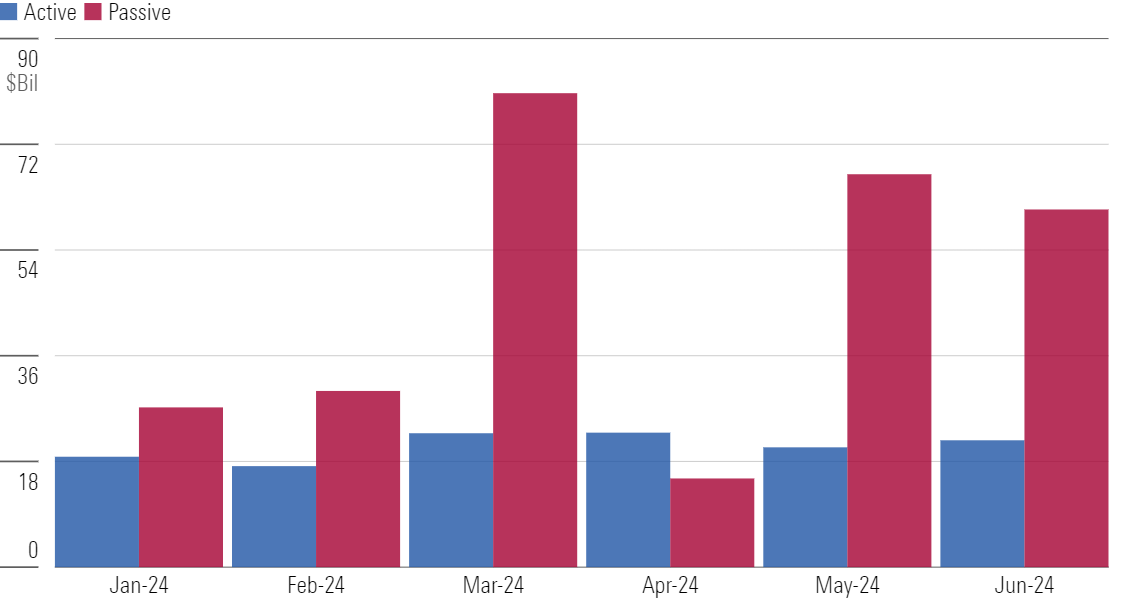
Active ETFs hauled in $123 billion in the first half of 2024—a hair short of the $124 billion they collected in 2023, an annual record. Active ETFs represented 7% of the ETF market entering the year and claimed 30% of all ETF flows in the first half. They cracked at least 25% of net flows in all major category groups save for commodities and US equity, where broad-based index trackers have held their ground.
My colleagues and I dove into the factors driving the active rise, where they make sense, and which firms are winning the race on the latest episode of the Investing Insights podcast.
Monthly Net Flows Into Active and Passive ETFs
Bitcoin and Buffer ETFs Pave the Way for Alternative ETFs
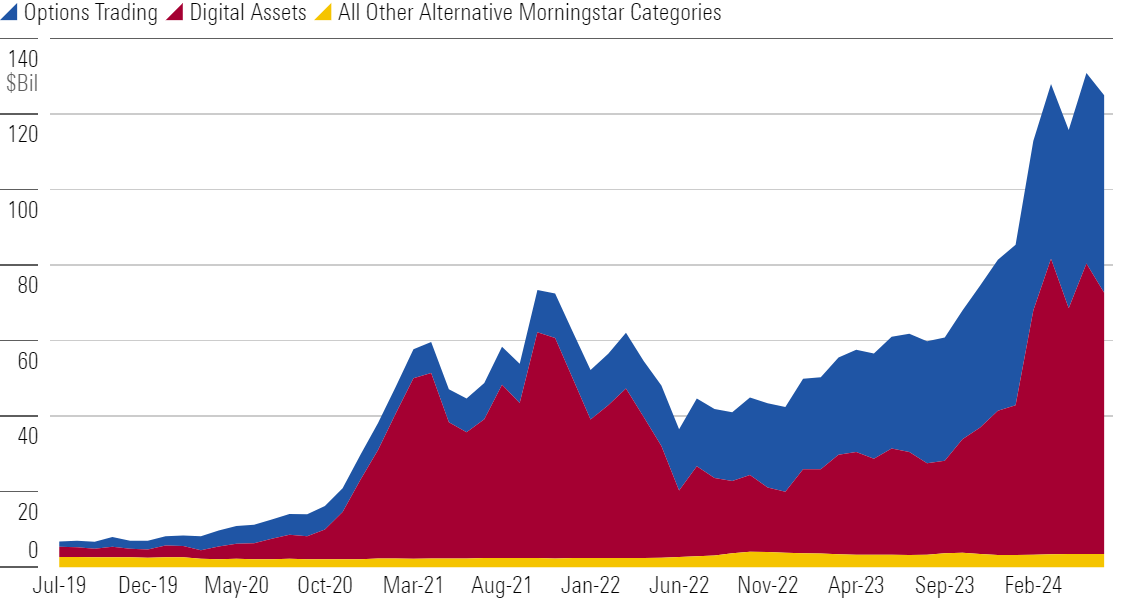
The buzziest ETF headline from the first half came in January when the first batch of spot bitcoin ETFs hit the market. Their immediate popularity ushered $16 billion into the digital-assets category, by far its largest semiannual inflow to date. IShares looks like the winner from the bitcoin ETF arms race. IShares Bitcoin Trust IBIT racked up $18.0 billion in just under six months on the market. Fidelity Wise Origin Bitcoin ETF FBTC reeled in $9.2 billion of its own. The imminent arrival of spot ethereum ETFs stands to give this category another jolt, though of a smaller magnitude than their bitcoin trailblazers.
Buffer ETFs also helped propel the alternatives cohort. These funds, which sit in the options-trading category, offer downside protection in exchange for upside return. They took off during the 2022 bear market but have since proved to be more than a fad. Investors poured $8 billion into buffer ETFs in the first half, driving their total assets over $50 billion.
Bitcoin and Buffer Funds Have Powered Alternative ETFs to New Heights
IShares Back in the Race After a Record Month
IShares pulled in $47 billion in June—a monthly ETF flows record for any provider.
Long-awaited flows into iShares’ stock ETF lineup drove the banner month. IShares equity funds reeled in $29 billion in June after collecting just $5 billion in the prior five months. IShares Core S&P 500 ETF led the charge with an $11 billion intake, and heavy inflows into growth ETFs like iShares S&P 500 Growth ETF IVW bolstered the case. IShares’ bond ETFs have been far more consistent. They collected $12 billion of their own in June, spearheaded by the $4.8 billion that funneled into iShares 20+ Year Treasury Bond ETF.
First Half Flows for the 10 Largest ETF Providers
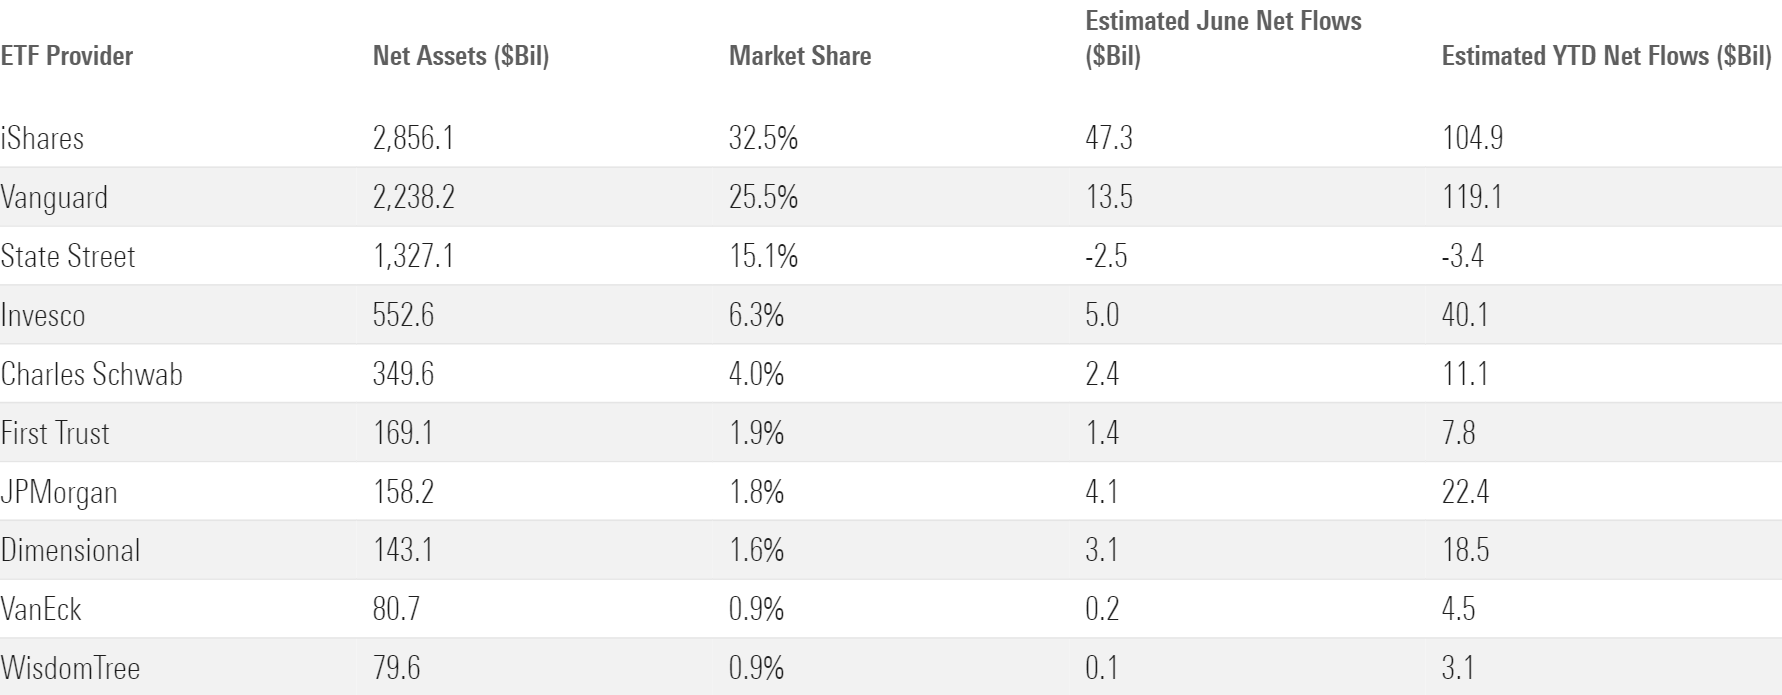
Vanguard was cruising to its fifth straight annual ETF flows crown before iShares hurled the $47-billion wrench into the equation. Vanguard now leads its top competitor by just $14 billion with six months left on the calendar. And that margin shrinks to $4 billion when accounting for BlackRock’s active ETFs, which are branded separately in the Morningstar database. This will be a fun race to watch in the second half.
The author or authors do not own shares in any securities mentioned in this article. Find out about Morningstar’s editorial policies.

/s3.amazonaws.com/arc-authors/morningstar/30e2fda6-bf21-4e54-9e50-831a2bcccd80.jpg)
/cloudfront-us-east-1.images.arcpublishing.com/morningstar/UEU7ZJHEKBDGBHFL6N73M24EYY.png)
/cloudfront-us-east-1.images.arcpublishing.com/morningstar/HDPMMDGUA5CUHI254MRUHYEFWU.png)
/cloudfront-us-east-1.images.arcpublishing.com/morningstar/AGAGH4NDF5FCRKXQANXPYS6TBQ.png)
:quality(80)/s3.amazonaws.com/arc-authors/morningstar/30e2fda6-bf21-4e54-9e50-831a2bcccd80.jpg)